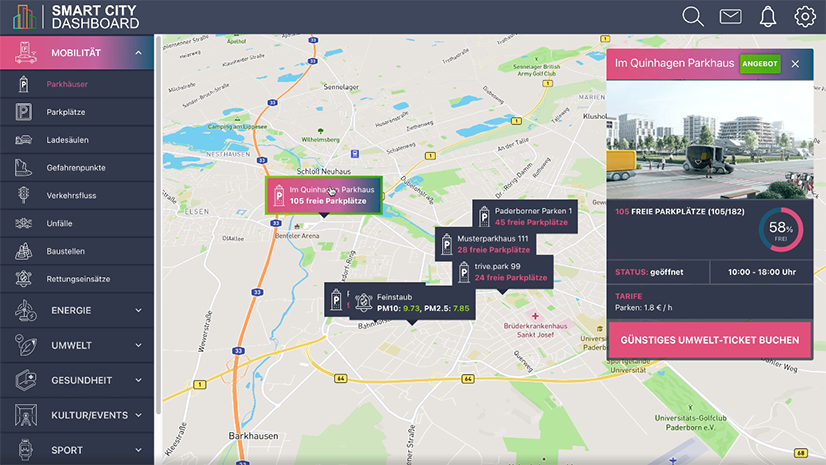
The goal of this project is the visualization of data from the FIWARE-based central open data platform. By making the data available, especially in the form of charts, citizens and interested parties can be given an overview of the current state of affairs in the city.
First native fiware-based dashboard framework to visualize urban data platforms. In order to be able to analyze and process the collected data in cities, it helps to display them visually on a dashboard.
The framework consists of a frontend and a backend. The frontend visualizes the data it receives from the backend. The backend obtains the data from the open data platform using an intelligent polling mechanism and stores it temporarily, which keeps the load on the platform to a minimum. The following technologies are used for this, all of which were developed on an OpenSource basis and are state of the art:
Frontend – React Web App Communicates only with a central backend, the Orion Context Broker, via the NGSI-v2 REST API
Core backend (powered by FIWARE) Orion Context Broker uses NGSI-v2 REST API for data transfers
External services All services communicate with only one central backend, the Orion Context Broker, via the NGSI-v2 REST API
City of Paderborn City of Ulm City of Hünfeld Region Fulda KielRegion

